
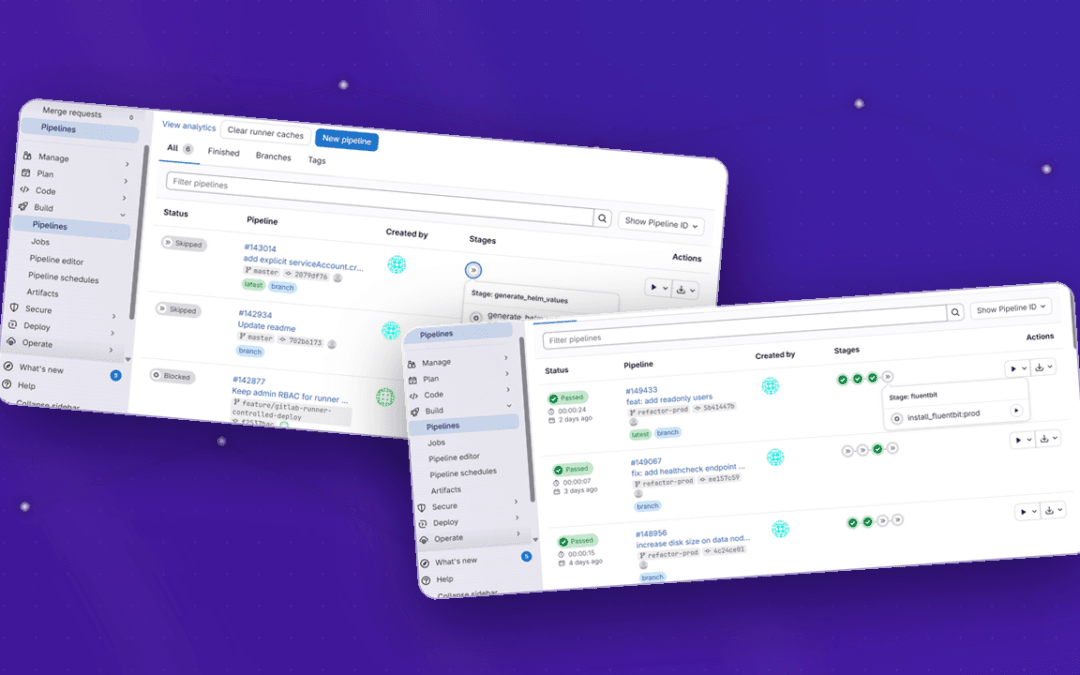
A DevOps pipeline is an automated workflow that takes a change in your code and moves it through building, testing, and deployment — all the way to production — while monitoring keeps it healthy once it is live. Think of it as an assembly line for software: instead of slow, manual, error-prone steps, each change flows through automated stages that make releases faster, safer and more predictable. In this guide we explain what a DevOps pipeline is, why it matters, its stages, and how it looks in practice — using real examples from our own projects.
What is a DevOps pipeline?
A DevOps pipeline is the set of automated stages that software passes through on its way from a developer’s laptop to your users. It combines continuous integration (CI) — automatically building and testing every change — with continuous delivery (CD) — automatically releasing and deploying that change — and wraps the whole thing in monitoring and operations so problems are caught before customers notice.
The key idea is that automation replaces manual, risky steps. Nobody copies files to a server by hand or hopes the tests were run. The pipeline does it the same way every time, which is exactly why software becomes faster to ship and far more reliable.
Why does a DevOps pipeline matter?
A mature CI/CD setup directly affects the business, not just the engineering team. Here is what it delivers:
- Faster releases — new features and fixes reach users in minutes, not days or weeks.
- Higher stability — continuous testing and monitoring dramatically reduce the number of production incidents.
- Fewer human errors — repetitive steps are automated, so nobody forgets a step or deploys the wrong build.
- Fast recovery — when something does break, the team is alerted and can roll back or fix it before users are affected.
- Lower cost — less manual work and fewer expensive “firefighting” emergencies.
- Scalability — the same repeatable process works whether you deploy once a month or fifty times a day.
How DevOps pipelines fit into the software development process
DevOps pipelines are not a one-off setup — they become the backbone of your everyday software development process. Every feature, bug fix and configuration change flows through the same pipelines, so development teams spend less time on manual release work and more time building product. Testing runs on every commit, and deployment to staging and production turns into a routine, low-risk step instead of a scheduled, stressful event.
This is also what lets DevOps pipelines scale across multiple teams. When several development teams share one consistent process, a new engineer can ship code safely on day one, because the pipeline enforces the same testing and deployment rules for everyone. The outcome is a predictable delivery process where quality is built into development from the first commit rather than checked at the very end.
The stages of a DevOps pipeline
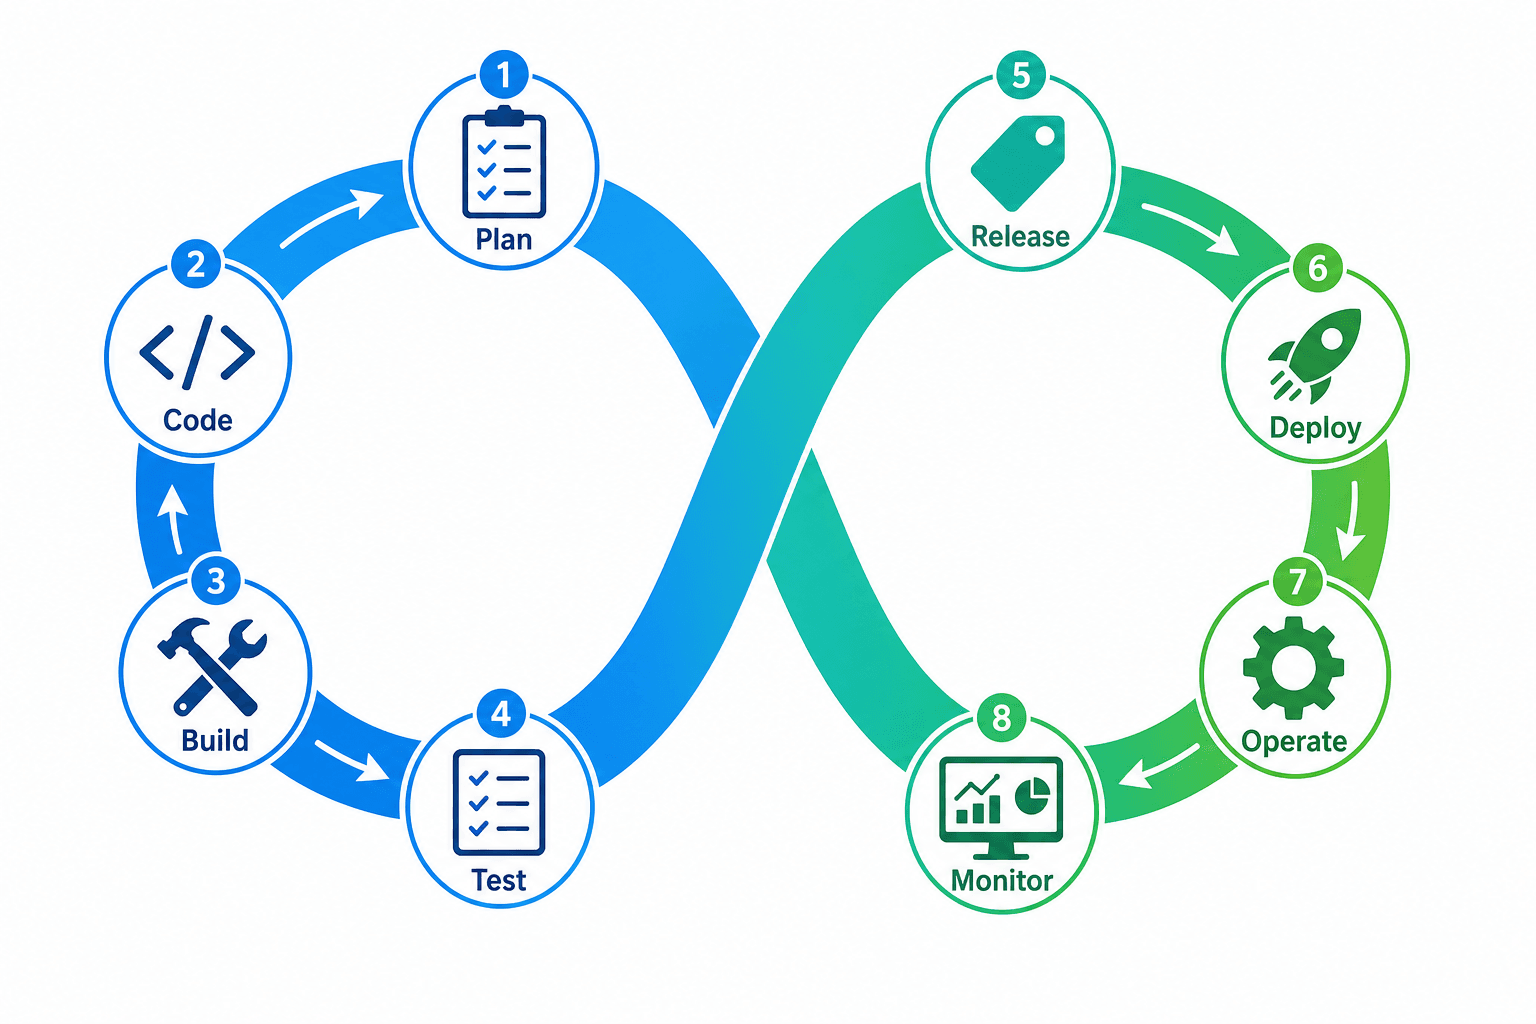
A DevOps pipeline is usually drawn as an infinity loop, because it never really ends — feedback from live systems flows back into planning the next change. Here are the core stages.
1. Plan & code
Work starts with planning what to build, then developers write the code and commit it to version control (typically Git). The commit is the trigger that sets the rest of the pipeline in motion.
2. Build & test (Continuous Integration)
As soon as code is committed, the pipeline builds the application and runs an automated test suite. If anything fails, the change is stopped here — long before it can affect real users. This is the heart of continuous integration.
3. Release & deploy (Continuous Delivery)
Once a build passes, the pipeline packages it and deploys it to the target environment — staging first, then production. With continuous delivery, this step is automated and repeatable, so a release is a routine event rather than a stressful one.
4. Operate & monitor (Observability)
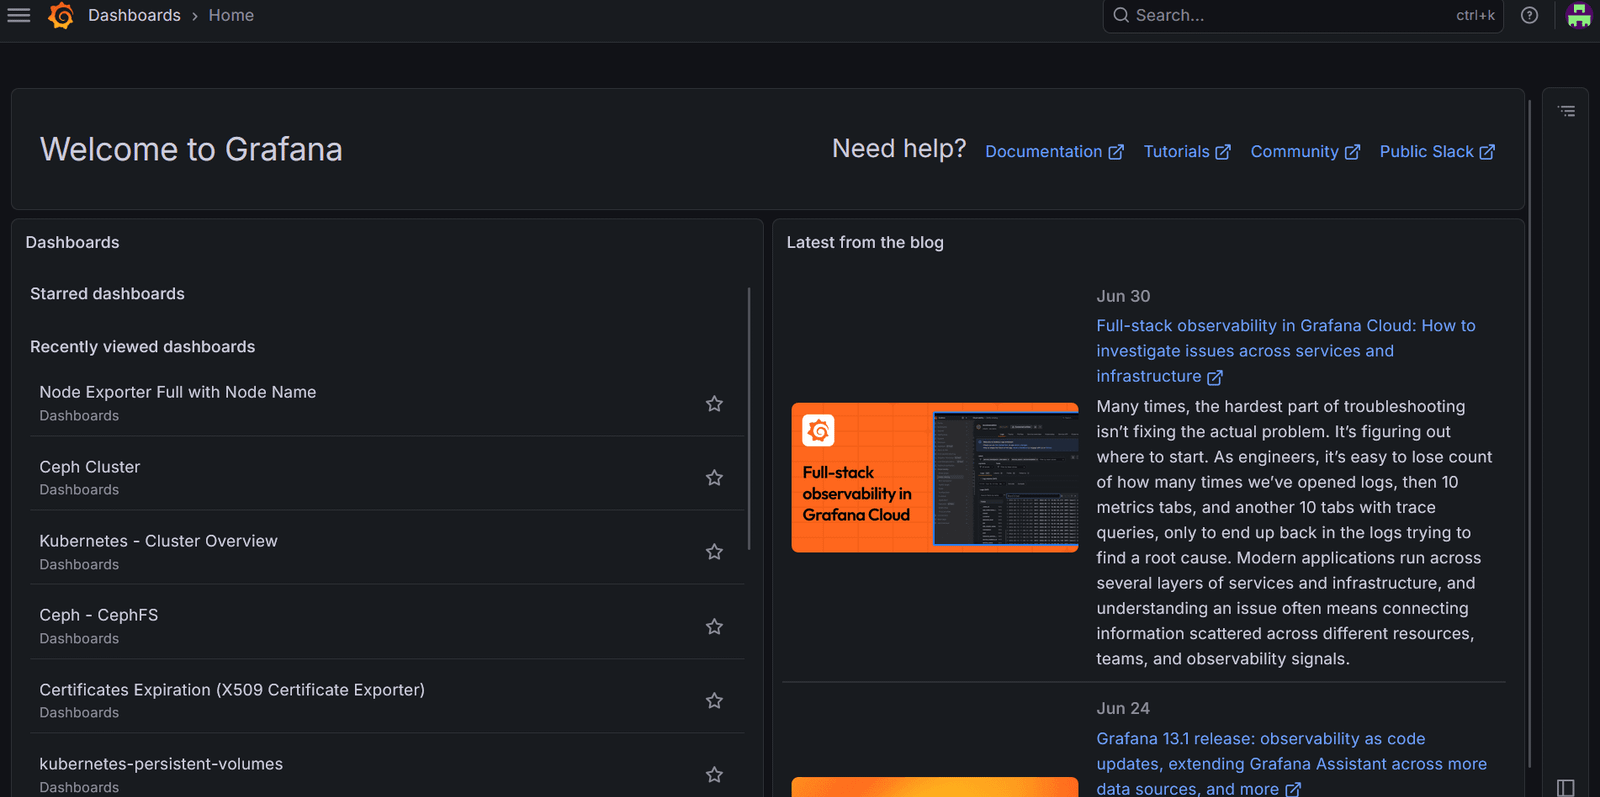
Deployment is not the finish line. The pipeline feeds into monitoring and observability: dashboards, metrics, logs and alerts that show how the system behaves in production. This is where problems are spotted early and insights flow back into the next round of planning.
CI/CD: the engine of the pipeline
At the core of every DevOps pipeline is CI/CD. Continuous integration automatically builds and tests each change; continuous delivery automatically ships it. Modern tools such as GitHub Actions, GitLab CI and Jenkins make this possible — every commit kicks off a run, and the team can see at a glance whether it is safe to release.
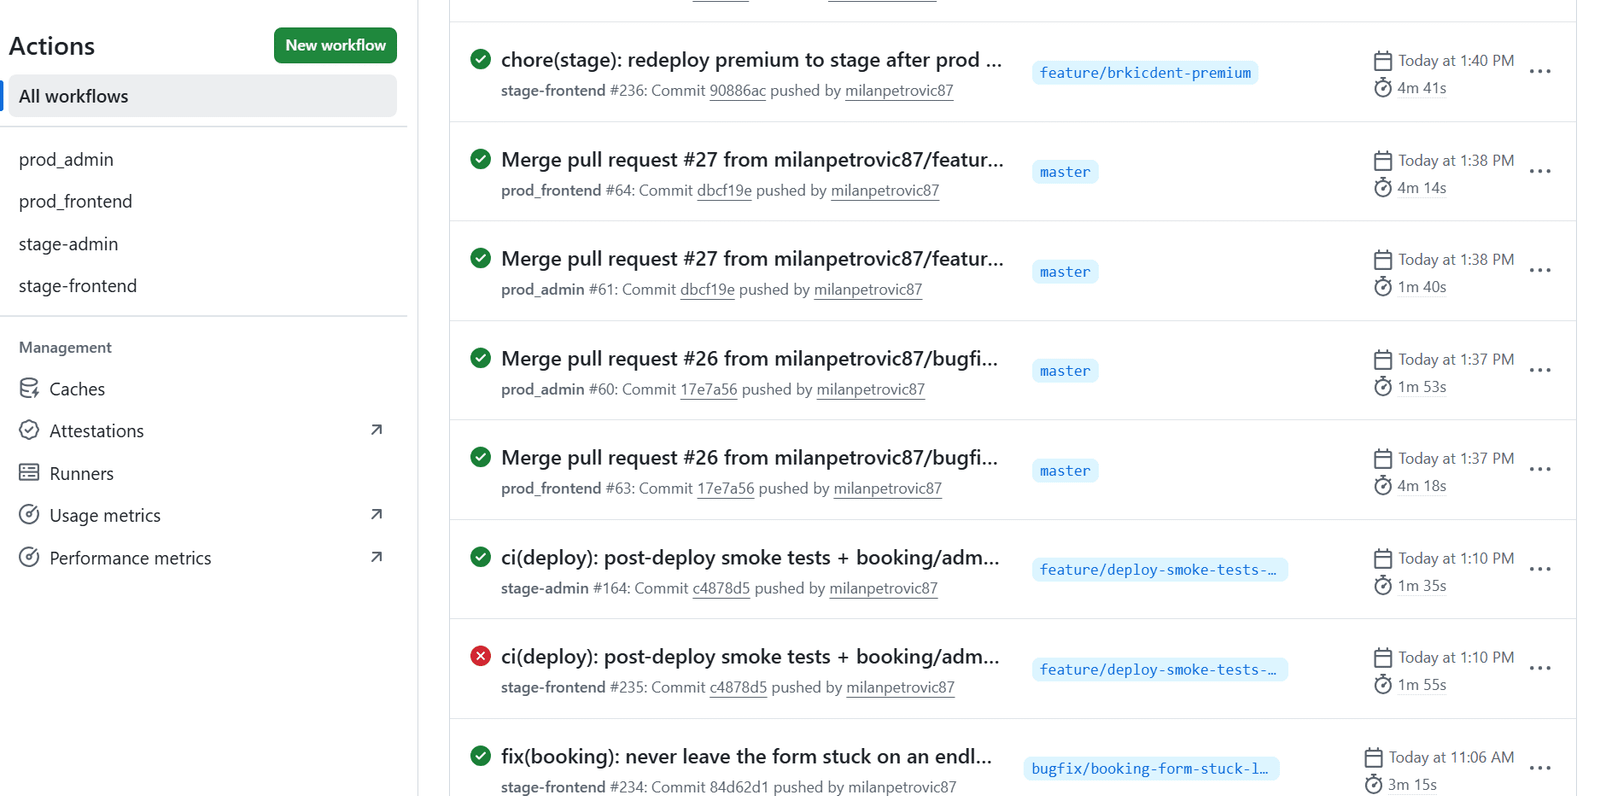
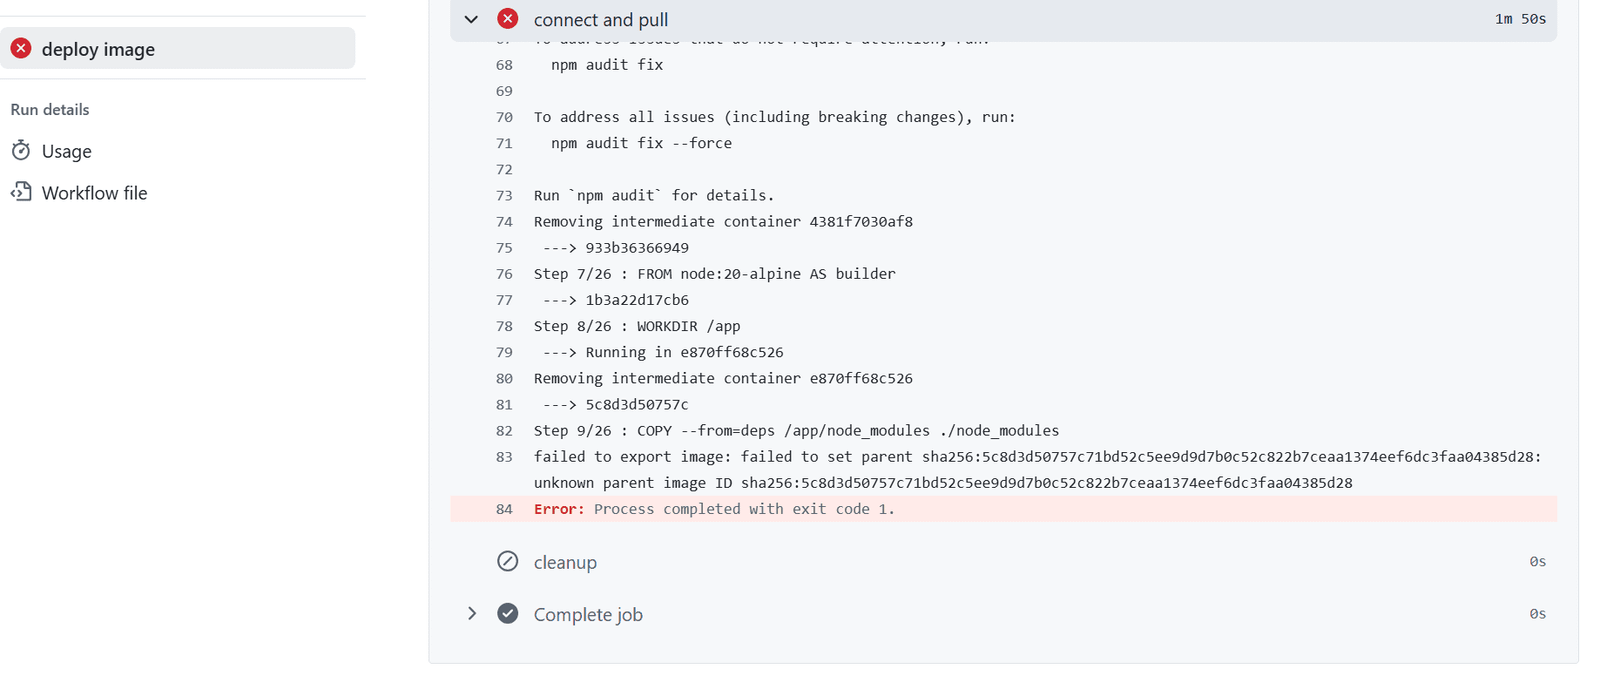
Because each commit is built and tested automatically, broken code is caught immediately instead of days later. The screenshot below shows the pipeline stopping a failed build before it could ever reach production — the safety net working exactly as intended.
A DevOps pipeline in practice — an example from our projects
The best way to understand a DevOps pipeline is a concrete example. For one application we maintain (a digital dental practice handling sensitive patient data) we built a complete, hands-off delivery process that runs without daily supervision:
- Scheduled daily backups of the database and files, with an off-server copy on a second machine — if the primary server fails, the data is still safe.
- Integrity checks — every day the system verifies that no stored document (for example a digital signature) has been corrupted.
- Smart alerting — instead of emailing the same list of errors every day and creating noise, monitoring compares the current state to a baseline and only emails when a new error or regression appears.
- Post-deploy smoke tests — after every release the workflow calls the live application to confirm it actually works, not just that the deploy “succeeded”.
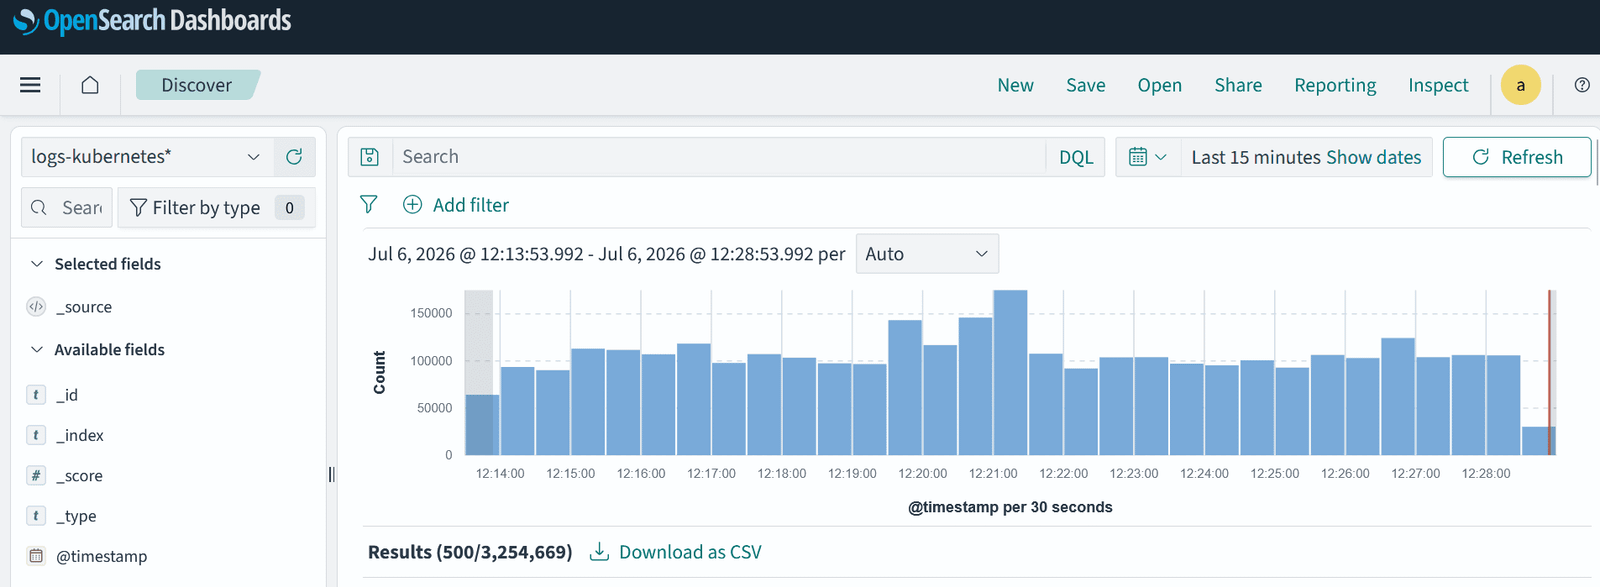
- Monitoring and logs — Prometheus and Grafana track server load in real time, while centralised logs make it possible to find the root cause of any issue in minutes.
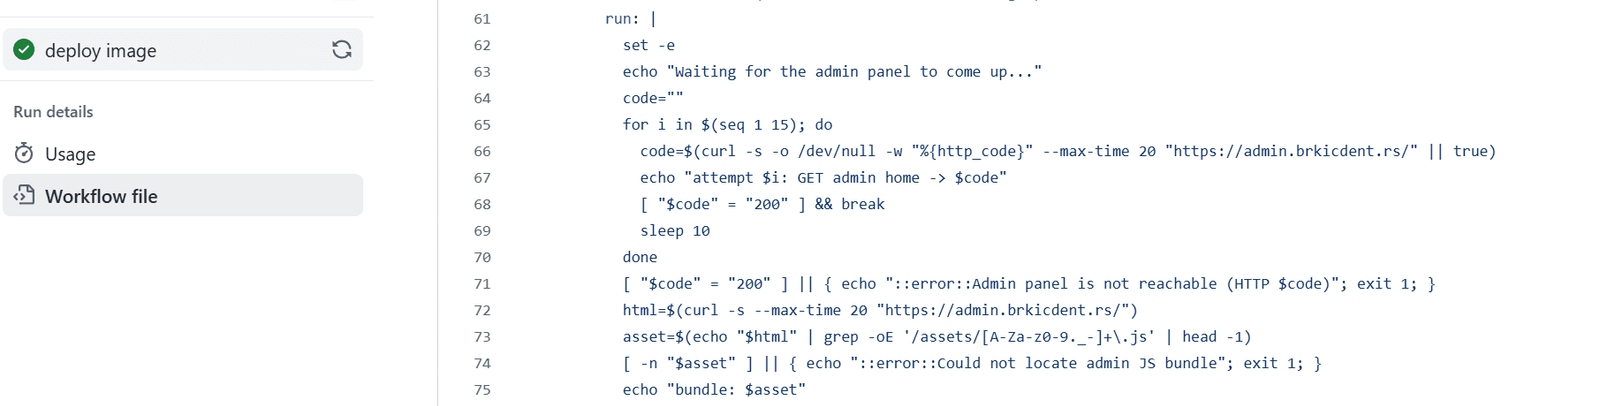
A deploy that reports “success” does not always mean the app really works. That is why a post-deploy smoke test is one of the most valuable stages in the whole workflow — it verifies the live system end to end. And when something does go wrong, centralised logs turn hours of guesswork into minutes of searching.
The result: the moment anything goes wrong — a service outage, a corrupted record or a load spike — an alert lands in our inbox and we react before end users ever notice. That is a DevOps pipeline in miniature: automation plus observability that deliver calm and reliability.
Common DevOps pipeline mistakes (and how to avoid them)
- Treating “deploy succeeded” as “it works” — always add a post-deploy smoke test that hits the live application.
- Skipping automated tests to “move faster” — this trades a few minutes now for painful outages later.
- Hardcoding secrets in the pipeline or repository — use a secrets manager such as HashiCorp Vault instead.
- No monitoring after deployment — a pipeline without observability is only half a pipeline.
- Alert fatigue — tune alerts against a baseline so the team only hears about genuinely new problems.
DevOps vs DevSecOps — securing the pipeline
Speed should never come at the cost of security. DevSecOps is a DevOps pipeline with security built into every stage — secrets management, dependency scanning and least-privilege access as part of the flow rather than an afterthought. If you want the full comparison, read our dedicated guide on DevOps vs DevSecOps.
DevOps pipeline as a service — how Synapps helps
If you do not have an in-house DevOps team, you do not have to build all of this yourself. Through our DevOps consulting and support we set up CI/CD, monitoring, backups and cloud infrastructure, and take on ongoing technical support. You get the same level of automation and reliability as large engineering teams — scaled to the size of your project and budget.
Frequently asked questions about DevOps pipelines
What is a DevOps pipeline in simple terms?
What is the difference between a CI/CD pipeline and a DevOps pipeline?
What are the main stages of a DevOps pipeline?
What tools are used to build a DevOps pipeline?
Is a DevOps pipeline the same as DevSecOps?
Conclusion
A DevOps pipeline is the automated backbone of modern software delivery: it takes every code change through build, test, deploy and monitoring so releases are faster, safer and more predictable. Add security with DevSecOps and observability with proper monitoring, and you have a system that lets you ship with confidence. If you would like to introduce a DevOps pipeline to your project, explore our DevOps services or get in touch for a free consultation.
After building pipelines for teams at very different maturity levels, our honest take is that the exact stages matter less than the feedback loop. A pipeline that takes forty minutes to tell you something broke is a pipeline people quietly route around. We optimize for fast, trustworthy signal first — cache aggressively, fail early on the cheap checks (lint, unit, SCA), and gate the expensive ones behind them. And we treat security as a stage, not a quarterly audit: running Trivy and Snyk in-pipeline means a vulnerable image never reaches production in the first place.
— Milan Petrović, Senior Cloud/DevOps Engineer · CKA, RHCE, RHCSA